
Educational Resources for Traders
Browse through TheCalculatedTrade’s curated collection of trading courses, guides, and market insights.
Daily Technical Analysis
Our Daily Technical Analysis delivers clear, actionable market insights on top forex pairs, crypto assets like Bitcoin and Ethereum, and commodities such as Gold — all tailored for both beginners and seasoned traders.
Showing 1-10 of 32 educational posts

Bitcoin Price Analysis: BTC Faces Key Resistance at $114K – Will the Downtrend Continue?
Bitcoin is currently trading within a descending channel, reflecting a bearish structure in the mid-term. Price has recently tested the lower boundary of the channel (~$109,000) and bounced slightly upward.

Gold Daily Market Update: Price Stuck Between $3,627 and $3,709 – Breakout Coming?
Gold has been in a strong uptrend, pushing higher over the past weeks. On the daily chart, price is now consolidating between $3,627 (support) and $3,709 (resistance).
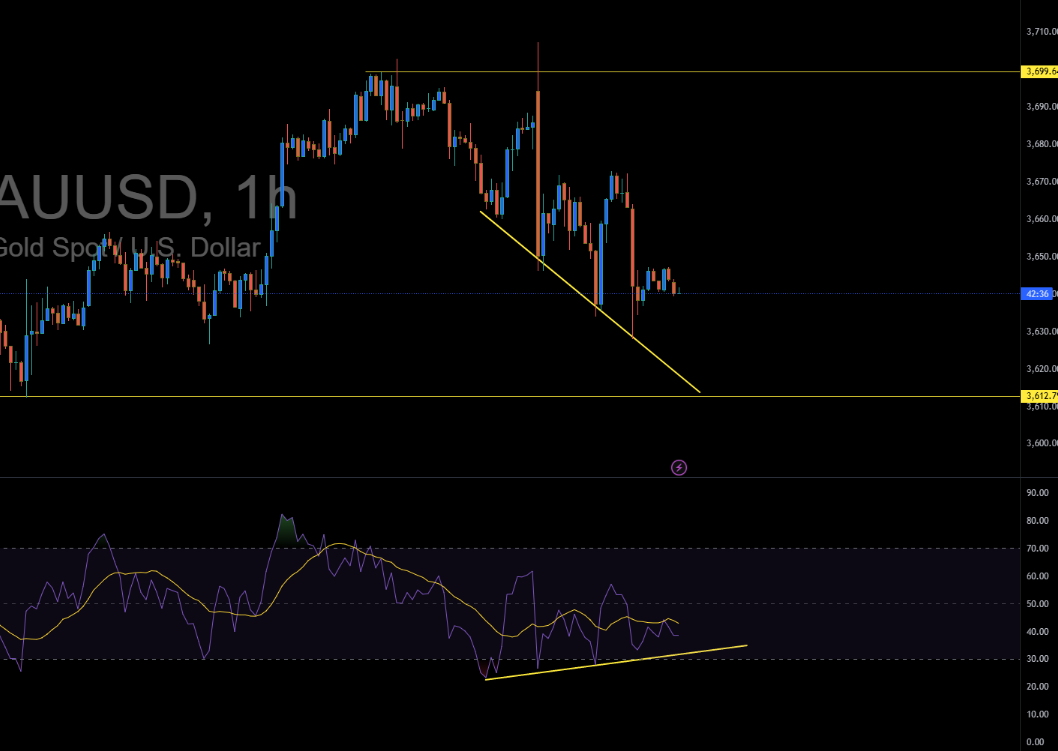
Gold Price Today: RSI Divergence Signals Possible Rebound – Is a Bounce Coming?
Gold is showing early signs of a bullish divergence on RSI, which could mean a bounce is coming. However, the trend remains fragile, and traders should watch the $3,612 support zone closely. A rebound toward $3,670 is possible, but a breakdown could open the door for deeper losses.
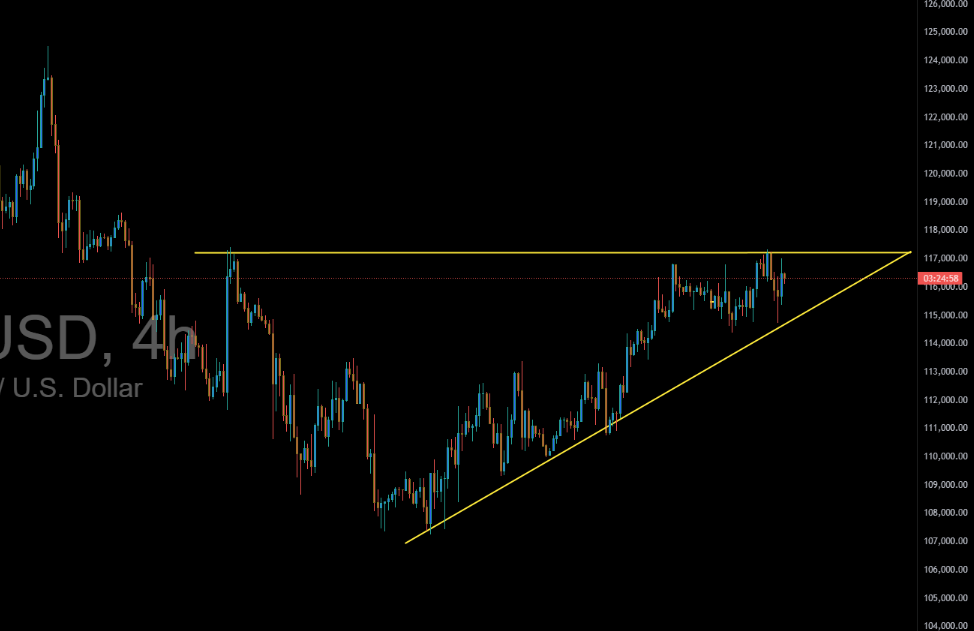
Bitcoin Price Outlook: Ascending Triangle Breakout Looms After FED Rate Cut
Bitcoin is currently trading within a classic ascending triangle formation on the 4-hour chart, signaling growing bullish pressure despite recent market uncertainty. The pattern is defined by a rising trendline of higher lows and a flat resistance zone around $117,000, a level that has capped multiple attempts at a breakout.
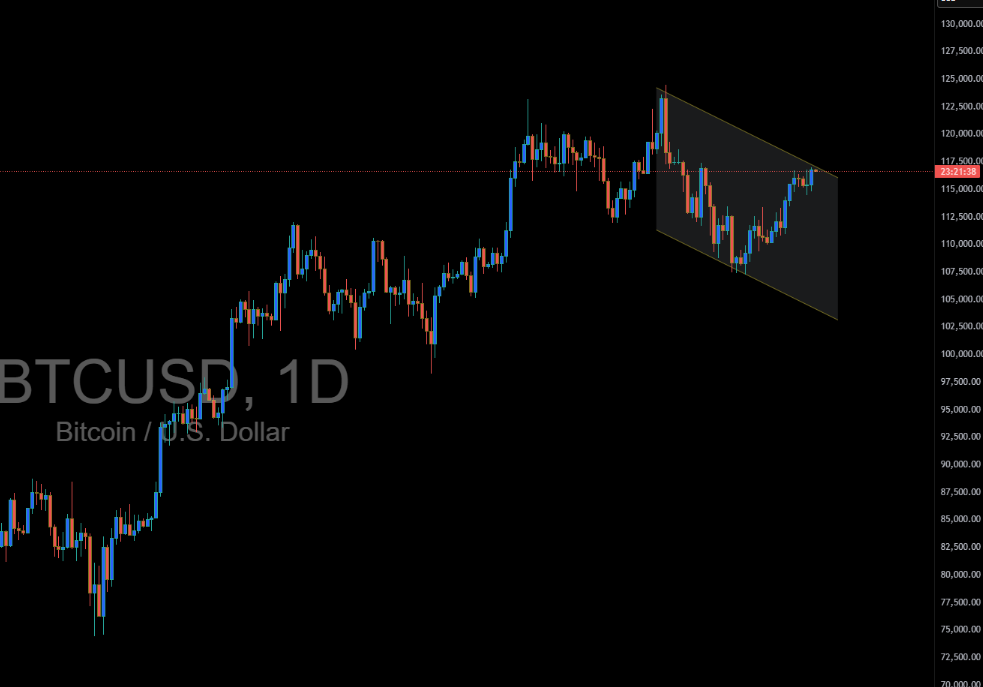
Bitcoin Consolidates Ahead of FED Decision – Breakout Looms
Bitcoin is currently trading around $115,000, showing resilience after rebounding from the lower end of a falling channel. On the daily chart, BTC has been consolidating inside this downward channel, with buyers recently pushing price back toward the upper resistance zone.
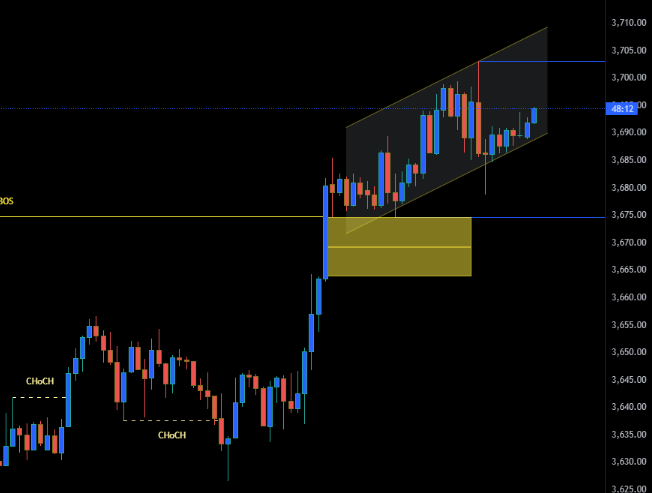
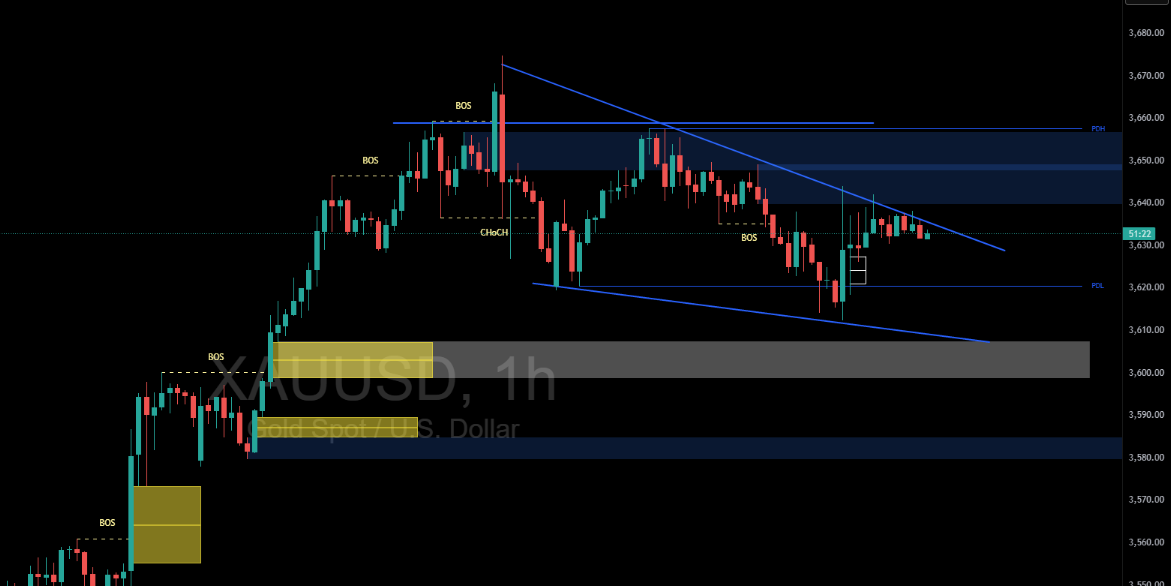
Gold Break of Structure and Possible Pullback Setup
Today’s price action shows a clear bullish momentum with strong upward movement. After two Change of Character (ChoCh) signals earlier, the market broke higher and created a Break of Structure (BoS).
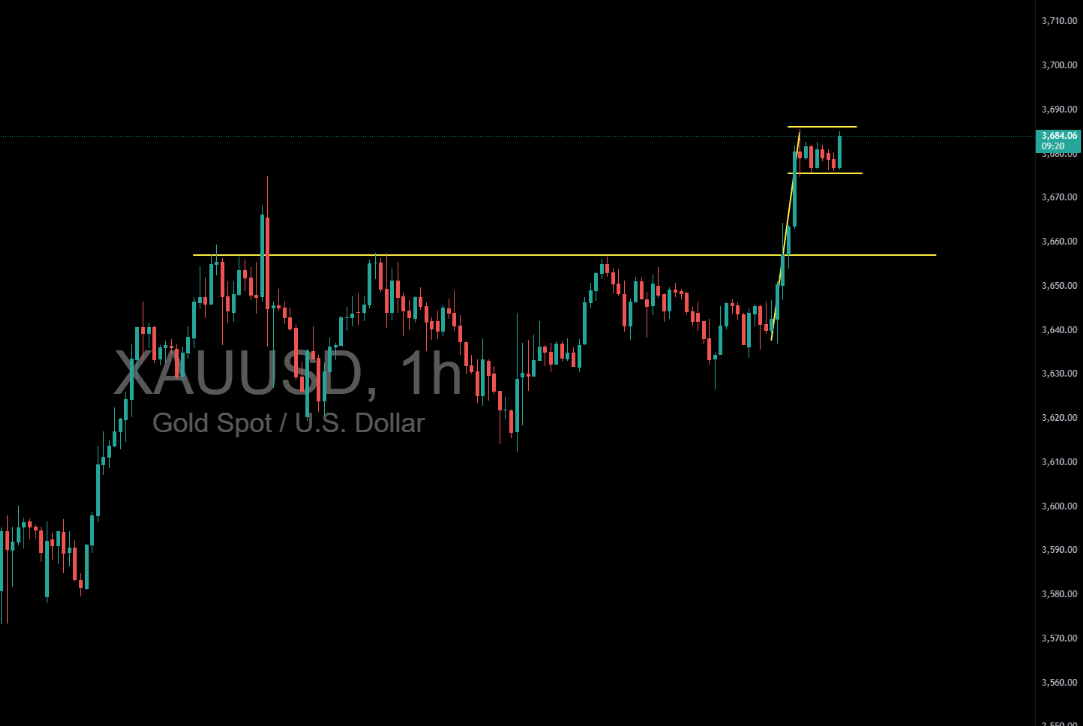
Gold Price Analysis Today: Will XAUUSD Break Higher or Pull Back?
Gold (XAUUSD) on the 1-hour chart is showing strong bullish momentum after breaking above the $3,655 resistance zone. Price surged upward and is now consolidating in a tight range between $3,670 – $3,690, forming what looks like a bullish flag or small rectangle pattern.
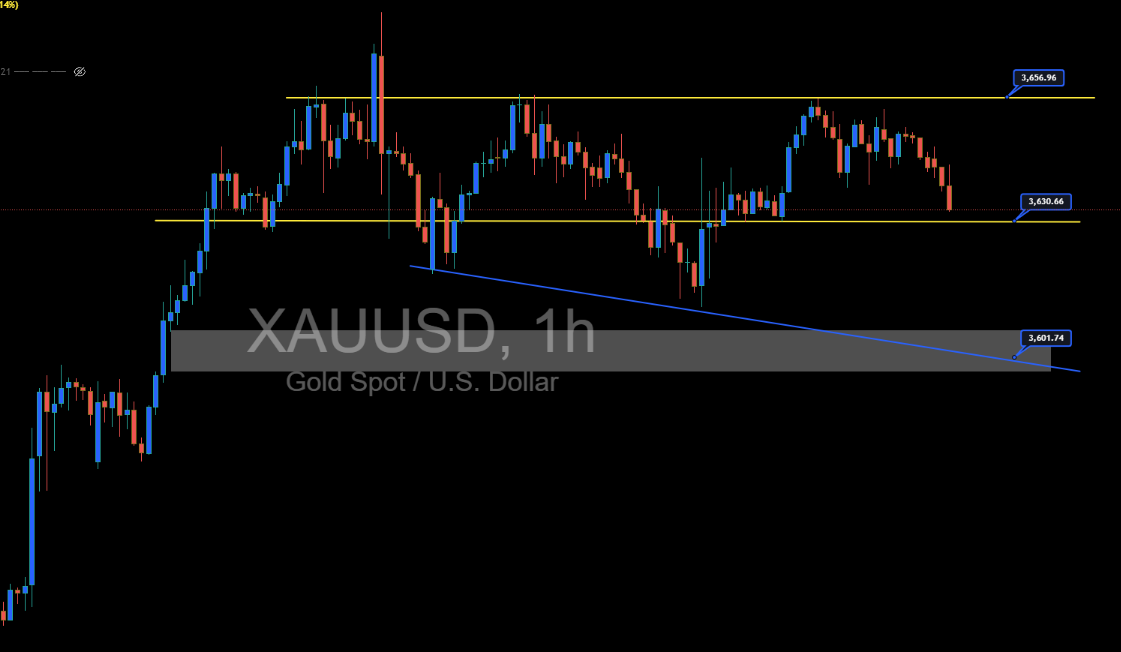
XAUUSD Daily Outlook: Bullish Bounce or Bearish Breakdown?
Gold (XAUUSD) is currently trading around $2,633, showing slight bearish pressure after failing to break higher. On the 1-hour timeframe, price is consolidating between key support and resistance levels. Let’s break it down in simple terms:
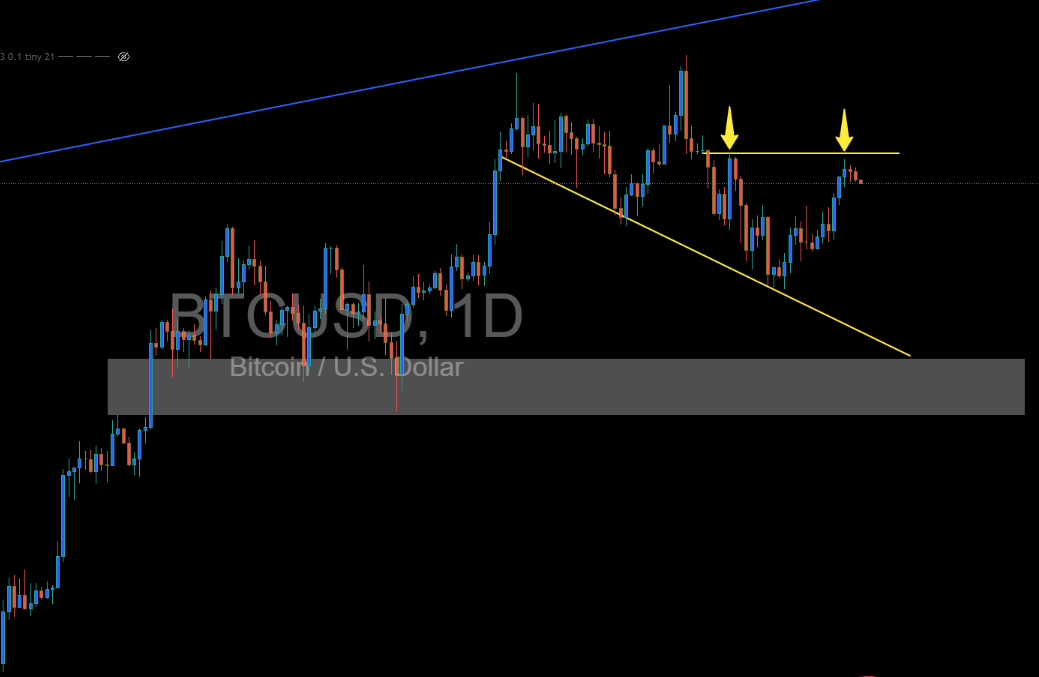
Bitcoin Price Analysis: Double Top Rejection Signals Possible Pullback
Bitcoin is currently trading around the $116,000 level after facing rejection near the $118,000 resistance zone (highlighted with yellow arrows on the chart). This zone acted as strong resistance in the past and once again rejected the recent bullish attempt. On the downside, BTC had broken below a descending trendline earlier but bounced back, showing buyers are still active. However, the market is now struggling to break higher, forming what looks like a double top pattern — a bearish signal suggesting potential weakness.
Gold Price Analysis After CPI Data: Will XAUUSD Break Higher or Continue Falling?
Gold (XAUUSD) is consolidating after the recent US CPI (Consumer Price Index) data release, which gave traders more clarity on inflation trends. Since CPI is a key measure of inflation, the results directly affect expectations around Federal Reserve interest rate decisions — and that’s why gold has been reacting strongly.
Why Learn with TheCalculatedTrade?
Our educational content is designed to be practical, actionable, and relevant to real-world trading scenarios. We cover technical analysis, fundamental analysis, risk management, trading psychology, and tailored strategies across cryptocurrencies, stocks, and forex.
Whether you are a beginner learning the basics or an experienced trader refining advanced techniques, TheCalculatedTrade provides reliable resources to empower your trading journey and help you make informed financial decisions.